Calls to Actions and Funnel Optimization
Optimize Your Conversion Rate
A website’s primary objectives are to draw in visitors and encourage them to take specific actions. These objectives are quantified by two key metrics: (1) the number of qualified visitors (traffic) and (2) the rate at which these visitors are converted into actions (conversion rates).
Why Do You Need To Optimize Your Conversion Rate?
Because Otherwise You Leave Money on the Table
Without clear calls-to-action, lead capture forms, and a conversion funnel, you miss sales opportunities and waste marketing dollars. Optimizing these can capture more quality leads and drive revenue growth. If you don’t prioritize conversion rate optimization, you risk fewer leads, slower sales, and wasted ad spend, lowering ROI. Strategic tweaks and testing turn more website visitors into leads and customers.

Did You Know?
The average e-commerce conversion rate is 2.93% (source: Statista)
The average landing page conversion rate is 2.35% (source: WordStream)
The average click-through rate (CTR) for Call-to-Actions (CTAs) is 3.27% (source: HubSpot)
The average A/B test improvement for CTAs is 23.2% (source: Econsultancy)
The majority of CTAs in blog posts achieve a CTR between 2 – 5%, with less than 10% seeing CTRs between 16 – 20% (source: Databox)
Percentage of blog readers who purchase a product or service after clicking on a CTA: 0.5-2% (source: Unbounce)
The average abandonment rate for shopping carts is 69.57%. (source: Baymard Institute)
The average abandonment rate for lead capture forms is 82.73%. (Source: sormstack)
How Do You Benchmark?
Where is the friction in your lead generation and sales funnel? Which stage would require attention first? How much impact does each stage’s optimization have on the bottom line? What are the decisions/actions needed to optimize each stage? What report/analysis/data is required to support these decisions?
Stage | Quantity (Based on Best in Class) | Best in Class (Conversion Rate) | Average (Conversion Rate) | Laggard (Conversion Rate) | Note |
|---|---|---|---|---|---|
Website Visitors | 1,000 | - | - | - | |
Web Leads | 67 | 6.7% | 5.5% | 3.1% | WebSite Conversion Rate |
MQLs | 24 | 35.6% | 22.3% | 9.7% | Lead Qualification Rate |
SQLs | 12 | 53.4% | 36.2% | 10.6% | Sales Acceptance Rate |
Sales Opportunity | 7 | 56.8% | 32.8% | 9.8% | Opportunity Conversion Rate |
Closed Leads (New Customers) | 3 | 45.0% | 29.0% | 21.0% | Deal Close Rate |
Benchmark Source: Aberdeen Group

Our Approach
A Different Approach to CRO
Our take on CRO at Analeads isn’t about doing a bit of everything. Instead, we zero in on what really gets visitors clicking – the CTAs.
Many firms include a vast array of website elements under the umbrella of CRO services, possibly to validate a higher billing. At Analeads, we diverge from this norm. Our services are bifurcated into two distinct categories: firstly, amplifying your traffic through a strategic focus on content quality and strategy; and secondly, refining the Calls to Actions to facilitate the customer journey towards engagement and purchase. Our CRO service is geared toward the latter. Our approach is streamlined for efficacy and transparency.
The Leaky Bucket Analogy
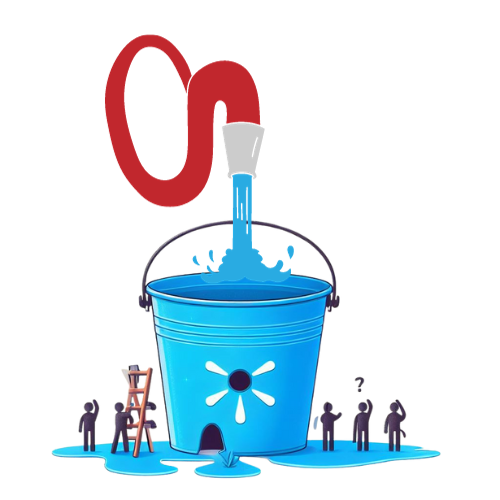
Analyzing digital marketing can be likened to the process of filling a leaky bucket. Consider your website as the bucket and the traffic it receives as the water you pour into it. Just as a bucket with leaks loses water, a website with an inefficient conversion funnel loses potential customers. The key is to first address the most significant leak at the bottom—the conversion funnel—before focusing on increasing traffic. At Analeads, we prioritize fixing and optimizing the crucial bottom end of your digital marketing “bucket”, ensuring that your efforts in driving traffic are not wasted like water pouring through unnoticed leaks. This approach ensures that every aspect of your digital marketing strategy contributes effectively towards achieving your goals, just as a well-maintained bucket holds every drop of water poured into it.

Do These Challenges Feel Familiar?
- Am I accurately identifying and addressing drop-off points in the conversion funnel?
- Am I tracking the right metrics to measure CTA effectiveness?
- Do you lack the capability to track micro-conversions that lead to desired macro goals?
- How can I craft CTAs that effectively encourage users to take action?
- Do I struggle to optimize the placement and design of CTAs for higher engagement?
- Am I leveraging user feedback and analytics to continually refine my CTA and funnel strategies?
- Is my sales funnel effectively guiding prospects toward conversion?
- How can I use A/B testing to improve CTA and funnel performance?
If you answered yes to one or more of these challenges, we can help you.
We Can Help You
Results Begin with Action
Our Analytics and Optimization Programs cater to a wide spectrum of businesses, ranging from those at the initial stages of their digital marketing journey to companies that are already well-established and seeking to scale their traffic and optimize their bottom line performance.
